Driver Analytics Guide & How-To
Last updated September 2, 2026
Driver Analytics gives fleet managers a clear view of driver activity and potential issues on the road. From one place, you can quickly identify drivers who may need attention and open the relevant records for further investigation.
This feature is available only when the Driver Analytics module is enabled on your account. To learn more, contact us at: team@onswitchboard.com or call 1-844-535-3387.
Driver Analytics Dashboard
Open Driver Analytics from the main navigation, then select the Dashboard tab to see an overview of your drivers and their current status.
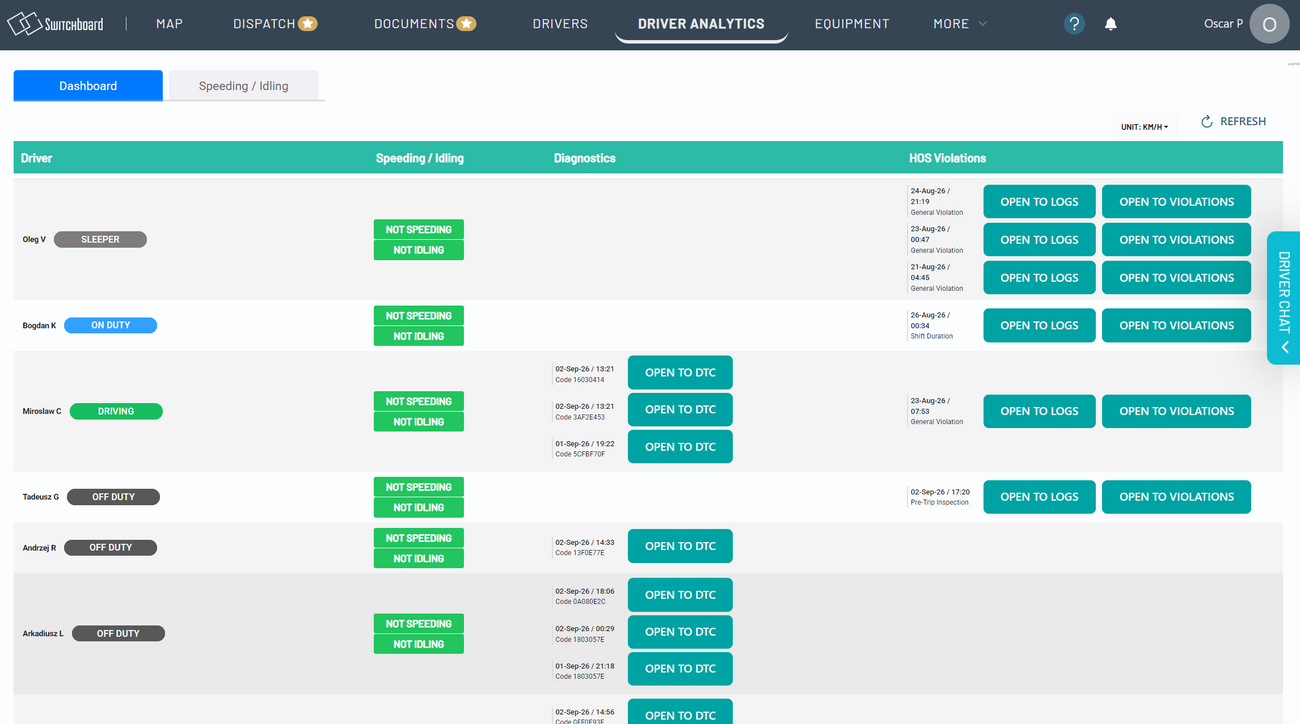
The dashboard helps you identify:
- Hours of Service violations
- Vehicle diagnostic issues
- Speeding
- Idling
Each driver appears in a separate row, along with their current duty status and any available alerts.
Review Hours of Service violations
When a driver has an Hours of Service violation, the dashboard displays the violation’s date, time, and type.
Use the available buttons to:
- Select Open to Logs to review the driver’s daily logs.
- Select Open to Violations to view the associated violation details.
Review vehicle diagnostics
Diagnostic trouble codes appear in the Diagnostics column with their date and time.
Select Open to DTC beside an entry to review the diagnostic trouble code and investigate the potential vehicle issue.
Check speeding and idling status
The Speeding / Idling column provides an at-a-glance status for each driver, making it easy to see whether speeding or idling activity requires attention.
Use Refresh to load the latest available information. You can also choose the preferred speed unit where that option is available.
Speeding and Idling Reports
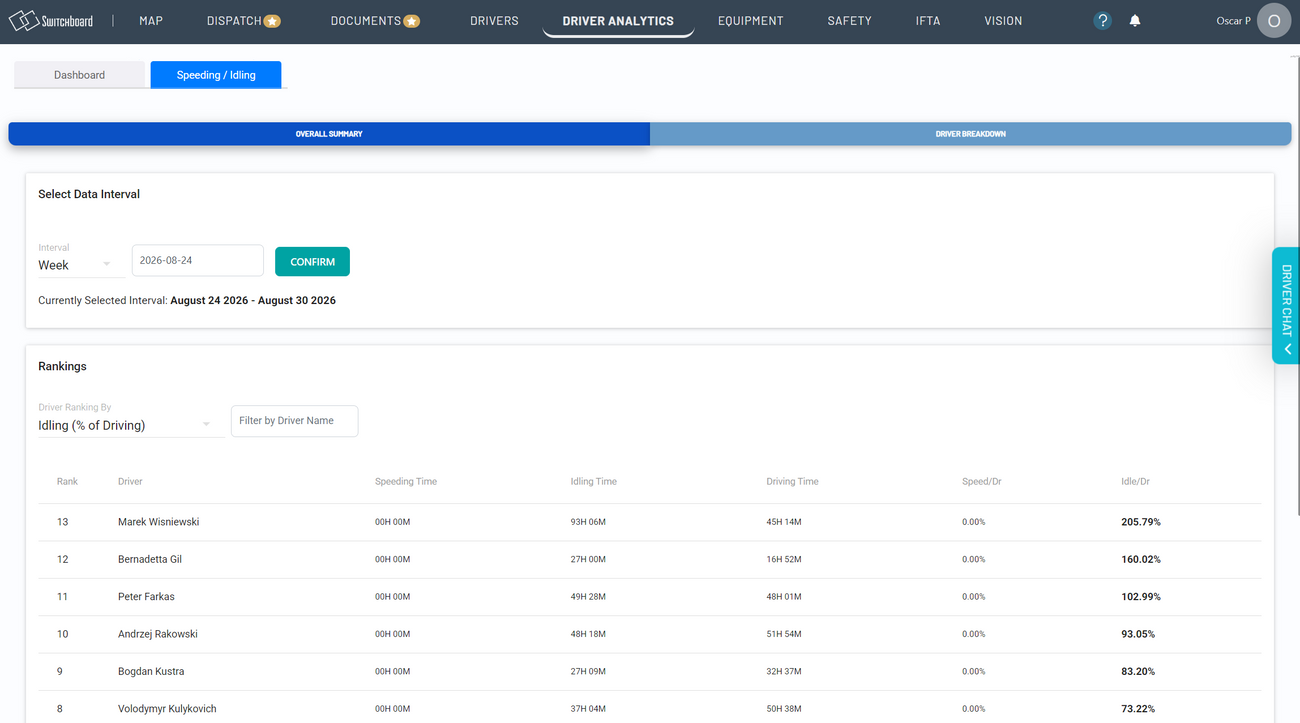
Select the Speeding / Idling tab for a detailed comparison of driver performance over a selected period.
Select a reporting period
Under Select Data Interval:
- Choose the interval you want to review.
- Select the applicable date.
- Select Confirm.
The currently selected date range appears beneath the controls.
Review driver rankings
The Rankings table displays each driver’s:
- Speeding time
- Idling time
- Driving time
- Speeding time as a percentage of driving time
- Idling time as a percentage of driving time
You can select a ranking category and filter the results by driver name.
Speeding reporting
Speeding results are ranked intelligently according to the percentage of total driving time spent speeding, rather than speeding time alone.
This provides a fairer comparison between drivers with different amounts of driving time. For example, a driver who spends 30 minutes speeding during two hours of driving may require more attention than someone who records the same speeding time across a much longer shift.
Use this report to:
- Identify drivers with a high proportion of speeding time.
- Compare performance across drivers and reporting periods.
- Prioritize coaching or follow-up based on driving behaviour.
Idling reporting
The idling report shows each driver’s total idling time and compares it with their driving time.
Use this information to:
- Identify drivers or vehicles with unusually high idling.
- Find opportunities to reduce fuel consumption.
- Support more efficient operating practices.
- Track changes in idling behaviour over time.
Note: A driver’s idling percentage may exceed 100% when their total idling time is greater than their total driving time during the selected period.
Regularly reviewing Driver Analytics can help your fleet respond to compliance concerns, vehicle issues, speeding, and inefficient idling before they become larger problems.